
If there is one trend that has surpassed Agile in our profession over the last five years, I would say DevOps would be a good culprit. As we’ve seen an explosion of tools to implement CI/CD in our Scrum teams, we’ve also seen some of our Agile practices being challenged by this new reality.
I would say those practices are the story points/relative estimation/poker planning. And I believe it is more than time we look at new techniques to replace them to fit the new reality of Scrum teams who are heavily influenced by DevOps.
From my experience with story points and velocity, we estimate a product backlog item (PBI) based on the effort it takes us to deliver a piece of functionality to our product owner. We then try to plot a velocity based on a set of PBIs we take every sprint.
For example, in the picture below, we visualize a PBI worth 3 story points represented with a blue bar. This blue bar contains all the work planned by the development team to complete the PBI.

I find this approach less and less beneficial as we move into a “You build it. You run it.” mentality. As we can now deploy features sooner and faster than ever, it brings its share of new responsibilities for developers. In such a context, I find Scrum teams do more customer support, resolve outages, fix bugs to keep production code going and monitor operational dashboards of their systems to name a few new tasks they have to tackle.
What challenges the use of story points, even more, is how the operational tasks of our Scrum teams can be hard to predict. Can we accurately predict how many sales engineers will call you next sprint with customer issues? Can we predict those two rack mounts are about to overheat because a service technician didn’t do his job correctly?
So while a 3 story points looked like the above picture when we operated in a pure development vacuum, we represent our new unpredictable tasks with red bars, thus extending our original 3 story points.
So how valuable is our story point system when those red bars keep showing up on our original estimates? If this is your situation, you’ve maybe tried doing better estimations or went with #noestimates. If you are still unsatisfied with those previous options, I believe there is a third way where unplanned work is embedded within the actual metrics.
Kanban metrics
I believe we are ready to move forward and adopt a third way which is rooted in empiricism. The approach comes from the Kanban community. They are called the Kanban metrics (or flow metrics). I find they are a great set of practices for the Scrum framework, especially when your context is closer to DevOps than pure development work.
As defined in the Kanban Guide for Scrum teams, the four basic flow metrics are:
- Work in Progress (WIP): The number of work items started but not finished. Note the difference between the WIP metric and the policies a Scrum Team uses to limit WIP. The team can use the WIP metric to provide transparency about their progress towards reducing their WIP and improving their flow.
- Cycle Time: The amount of elapsed time between when a work item starts and when a work item finishes.
- Work Item Age: The amount of time between when a work item started and the current time. This applies only to items that are still in progress.
- Throughput: The number of work items finished per unit of time.
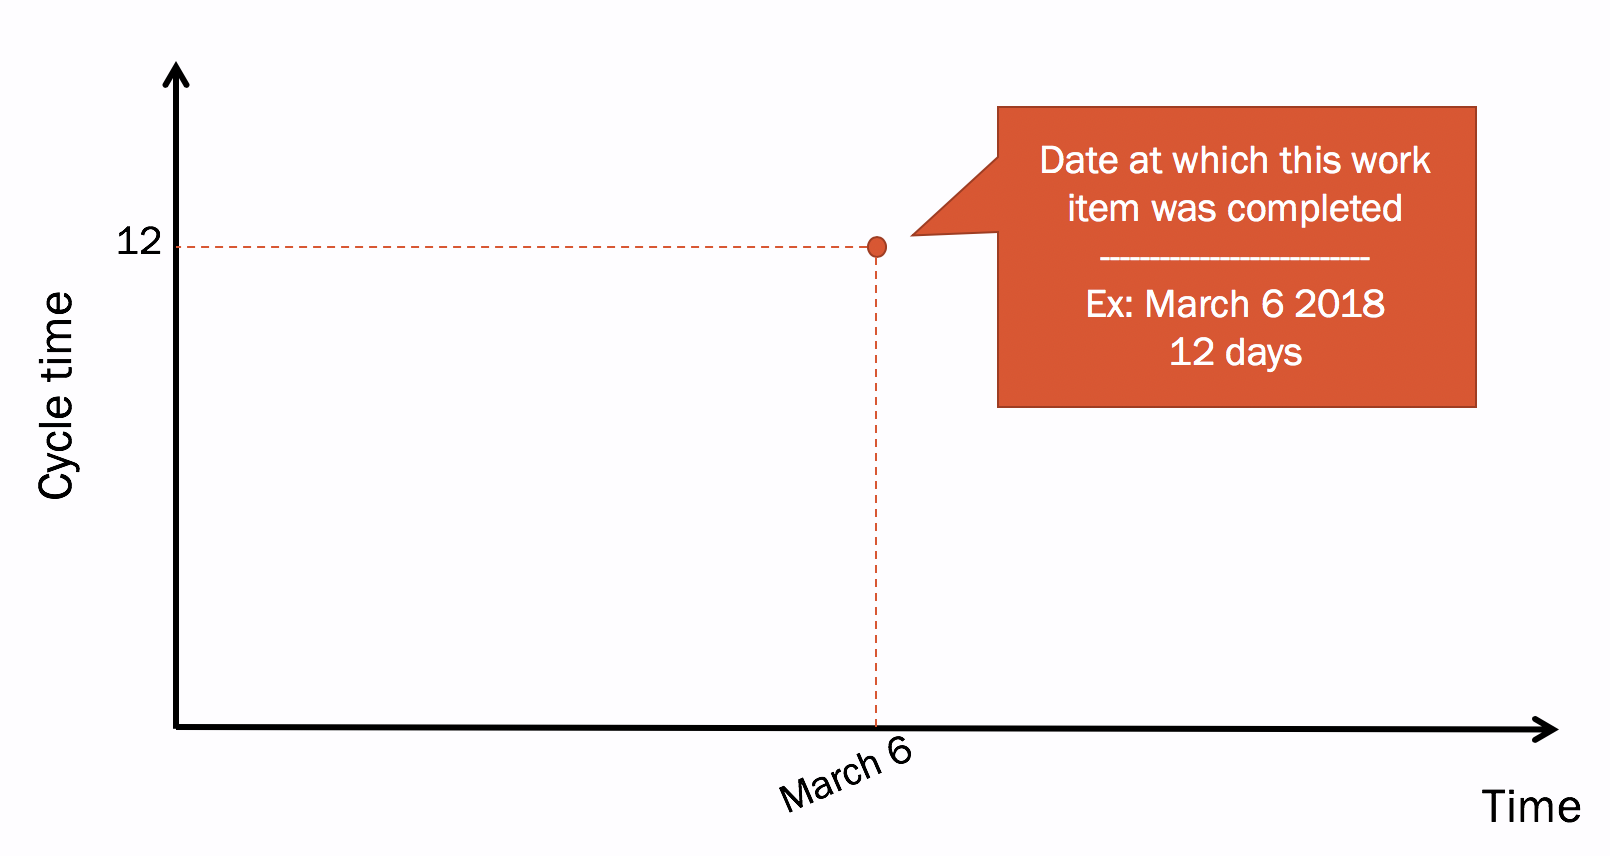
Let’s revisit our 3 story points above and look at it from the perspective of the cycle time. Let’s say it took 12 days from the moment we started working on it until we completed the PBI, including all the red bars shown in the previous picture.
Let’s plot it on a chart as shown in the following image where our item was completed on March 6, 2018.
Let’s then plot the rest of our completed PBIs on the chart. It now looks like this:
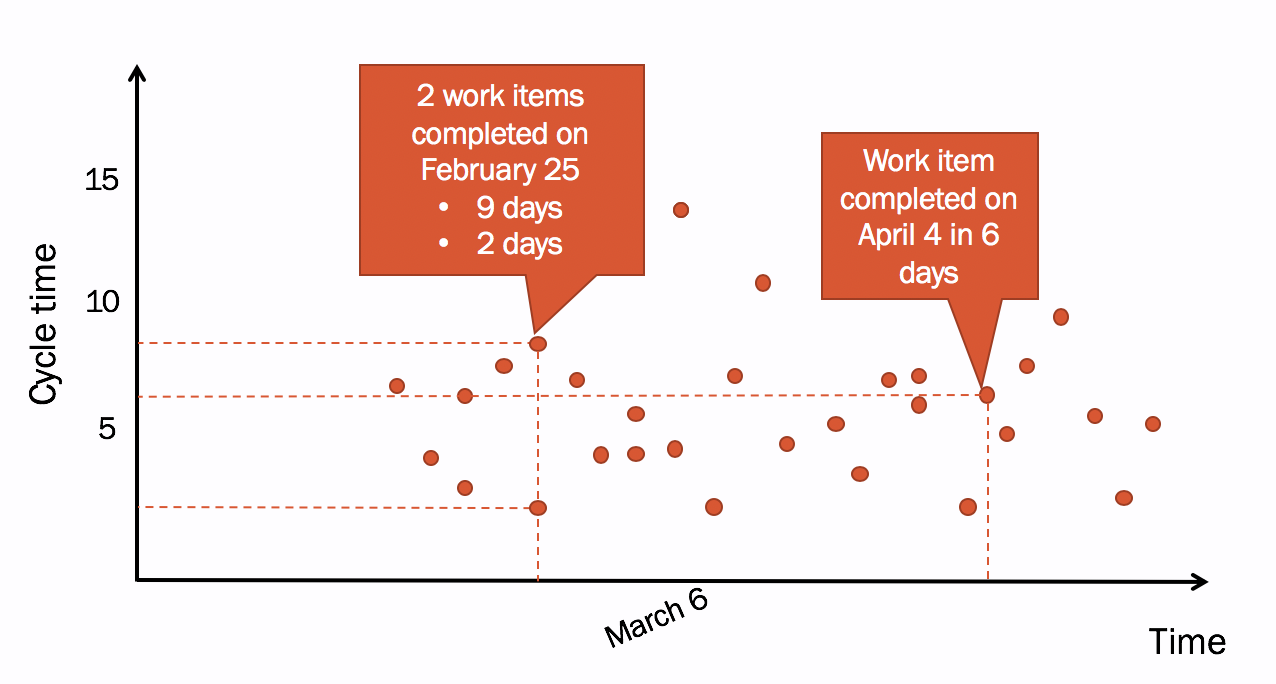
In the chart above, called a cycle time scatterplot, we see our PBIs completed by our Scrum team. I’ve put two tooltips on the chart to help the reader understand it better. On April 4, the Scrum team completed 1 PBI where it took 6 days to complete. On February 25, the Scrum team completed 2 PBIs, one took 2 days and another one took 9 days.
The final pieces of information to add to this cycle time scatterplot are percentile lines. In the chart below, I’ve added a second Y-axis on the right with percentile lines. A percentile line means that below the line, we have a percentage of all the dots plotted on the chart. A 50 % percentile line means we have 50 % of our points under that line while an 85 % percentile line means we have 85 % of our points under that line.
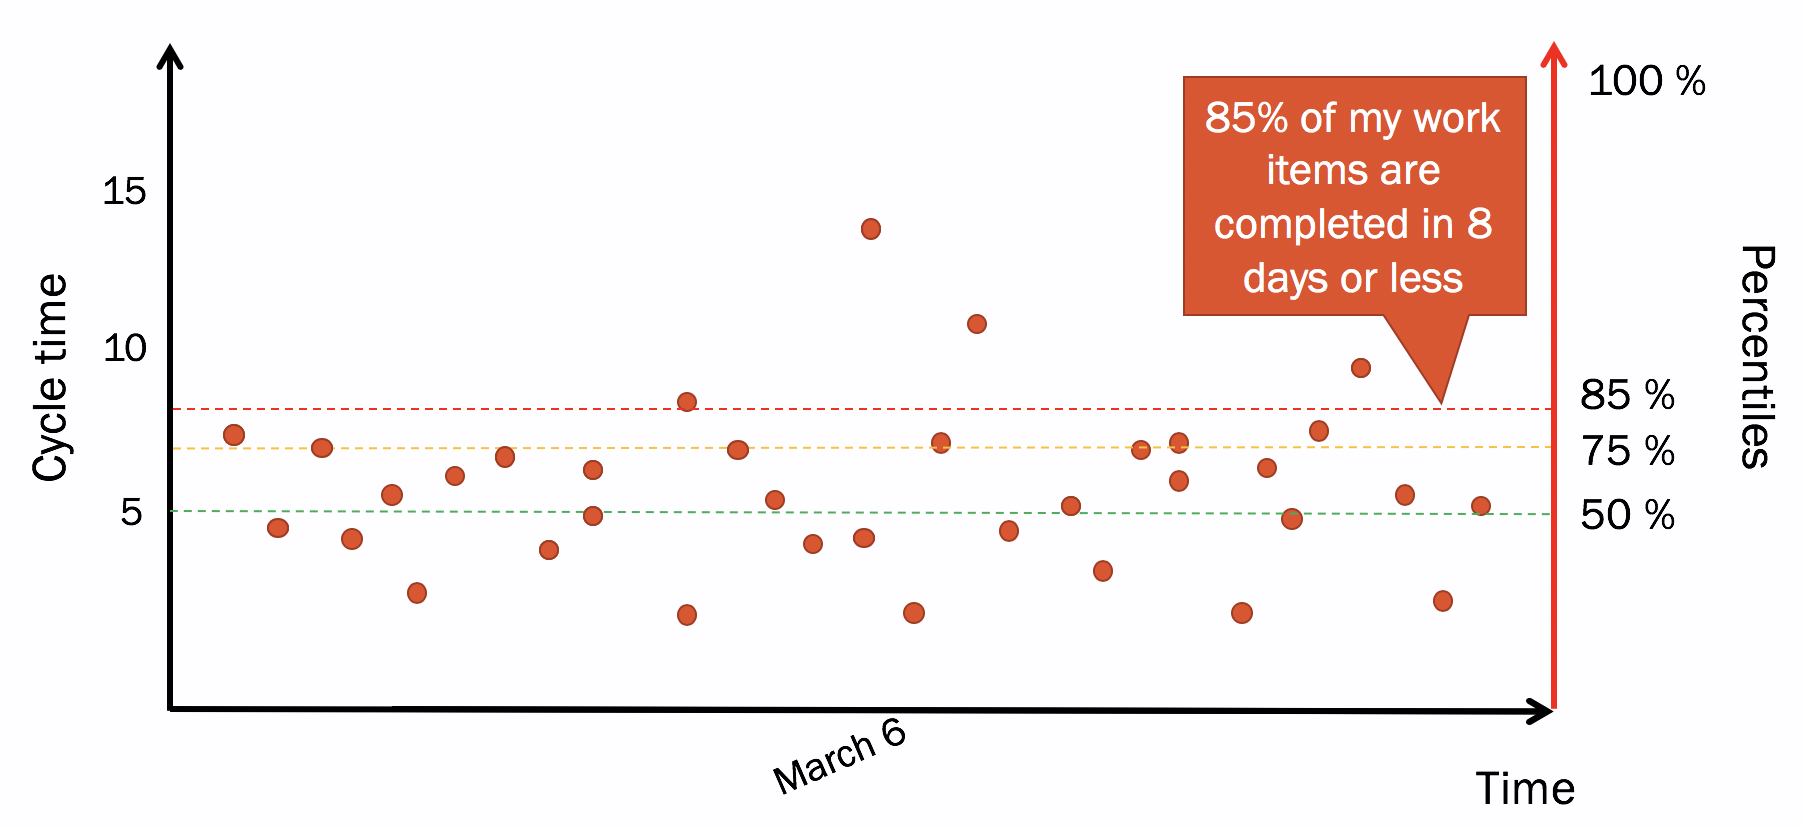
With the help of the chart above, we can state that 85 % of the time, our Scrum team completes a PBI in 8 days or less. We call this our Service Level Expectation (SLE) which forecasts how long it should take a given item to flow from start to finish within the Scrum Team’s workflow.
So instead of estimating our PBIs, arguing if it’s 2 or 3 points, we can ask ourselves if it falls below our SLE. If the answer is no, we have a conversation about splitting it (or not) to honor our SLE. If the answer is yes, we simply move on to the next PBI to refine. We still have the technical conversation around the PBI as we did before with story points. We just don’t do the poker planning part anymore.
At sprint planning, we either have PBIs who are below the SLE or exceptions with which our Product Owner is aware of. During the sprint, we actively monitor the age of our PBIs to minimize the chances they exceed the SLE.
The tip of the iceberg
If this post has spurred your interest, we are only touching the tip of the iceberg.
Kanban metrics can also help the development team forecast the number of PBIs it can take to achieve their sprint goal. In a subsequent post, I will talk about throughput-driven sprint planning. We will use another flow metric, throughput, to forecast our sprint in conjunction with the cycle time scatterplot. New techniques like probabilistic forecasting, right-sizing, and Monte Carlo simulations offer a new and fresh perspective at determining delivery dates. SLE and work item aging can change the conversations at your daily Scrum around the work.
For a deep dive into Kanban metrics, I strongly recommend Daniel Vacanti’s book Actionable Agile – Metrics for predictability. If you want to learn how to apply these metrics with your Scrum teams, I strongly encourage that you look at the class Professional Scrum with Kanban (PSK).
Yes, I’ll admit this is a shameless plug for the Professional Scrum with Kanban (PSK) course. At the same time, I strongly believe the PSK will help our industry with an alternative to story points which, I believe, is more appropriate with our new DevOps reality. As our industry has moved from waterfall to iterations in the last 15 years, I believe Kanban metrics will become the de facto standard when managing and forecasting our work in the near future.
If you’re interested in learning more about Kanban in another context, visit KanbanGuide.org.