The Agile Museum

December 10, 2019

I’ve been teaching the class Professional Scrum with Kanban (PSK) for the last year now and I strongly believe parts of its content will send some of our current practices and books to the Agile museum.

Through the help of the cycle time scatter plot diagram, I believe our decks of poker planning will end up in the Agile museum. Between our actual estimation techniques and the #noestimate movement, I believe the Kanban (or flow) metrics offer a historical perspective based on actual data.

Kanban metrics such as throughput avoids the confusion about story points and velocity when we explain these techniques to our customer. I’ve found telling my customer the team completed 4 PBIs is much better than talking velocity. While the book Agile Estimating and Planning by Mike Cohn is a classic, I would now say that some parts of it are ready to go to the Agile museum. I would replace it with Daniel Vacanti's book Actionable Agile – Metrics for predictability.

For the last year, I’ve looked at the relationship between cycle time and story points. In 75% of my cases, I get a chart similar to the following one where PBIs of 1, 2 or 3 pts all land in the same cycle time range. In the following chart, I’ve compared the story points of PBIs on the X-axis with their cycle time, from In Progress to Done, on the Y-axis.
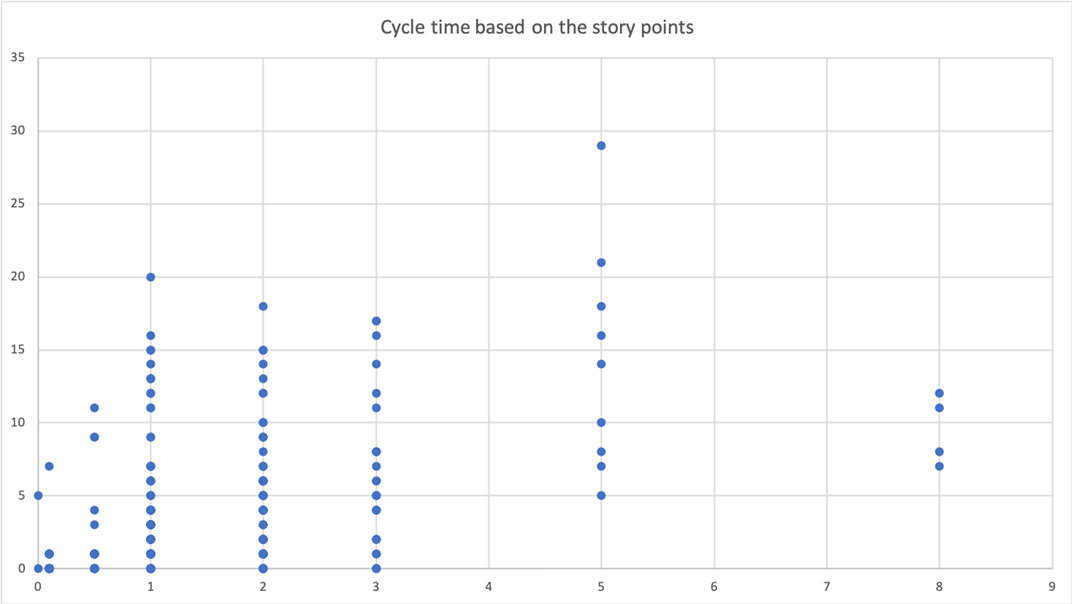
The relationship between story points and cycle time

So why waste time arguing between a 1, 2 or 3 points when we know historically they will fall in the same range of completion. Is your team in a similar situation?

While we’ve made great leaps forward over the last 20 years in our industry, going from waterfall to an incremental and iterative cycle, I believe it is important to keep in mind the first line of the Agile manifesto:

We are uncovering better ways of developing software by doing it and helping others do it.

Change is hard. It took us 20 years to adopt Agile in our industry. I believe we are now more than ready to stop our eternal conversation about estimations and move forward with historical data as our new way of forecasting our iterations, thus relegating our deck of poker planning cards to the Agile museum.


What did you think about this post?

Comments (6)


Karol Kłaczyński
02:02 pm December 10, 2019

Hey Louis,

Inspired by your article I decided to do the same for one of the teams I currently work with. Team started creating new product few months ago in a new company, so at the beginning we struggled to a bit with estimations, but still I thought it might be worth checking how does it work for me (I suspected more or less the same). The results are below:
https://uploads.disquscdn.c...

Although there are few exceptions (huuge underestimation at the beginning of the new product on the left top and right top corner), the trend seems to be pretty ok - from the left bottom corner up towards right side of the chart. I had less data than you, but maybe this is one of the cases, not general topic?

Still, looking for new techniques and metrics is always worth it :)


Dana V. Baldwin
06:56 pm December 10, 2019

For a norming or performing team I prefer to use lightweight story count per iteration time as well as rapid story mapping to generate an initial scope estimate that I can use as a burndown. Having a scope number that is not zero is closer to the truth than zero allows us to gain quickly the trust of the organization as we deliver predictability. It also allows us to highlight scope change.

For forming and storming teams I do the above but I also as them to point. Having some anchor stories can help these new teams have a meaningful conversation about the work. And maybe reduce the wild misses on estimation.

For either team I ask them to not estimate tasks and I won't work in organizations that task estimates or reporting in hours unless they can autofake it.

Thank you for sharing your empirical results.


Louis-Philippe Carignan
03:08 am December 11, 2019

Thanks for your comment Dana.


Louis-Philippe Carignan
03:10 am December 11, 2019

Glad to know my post helped you confirm the relationship between time and points has value.


Karol Kłaczyński
01:49 pm December 11, 2019

One more thing came to my mind - you mentioned gathering data from the last year. In theory 5SP PBI in January should last longer than e.g. in June same year, as team gains experience and more relatively same "sized" PBIs can be done within a Sprint, because velocity should grow. What do you think about the impact of this effect?


Louis-Philippe Carignan
06:17 pm December 11, 2019

Good question Karol.

When I mention the data for the last year, I was talking about multiple teams, not just one team as shown in the chart of my original post. I apologize for not being clear on this point.

In regards to velocity growing as the team gains experience, I should put more context about the teams I was referring too. My teams were DevOps in the sense they code and maintain their systems. In some periods of the year, they had more outages or emergencies to handle, which took a hit on the product backlog items they were working on. Another factor in my context is the Summer vacation. Being in Quebec City in Canada, we all take our vacations in the 2 months of Summer we have.

I can't find the quote but I remember Troy Magenis saying how cycle time includes unpredicatable things like outages, bugs and support to name a few. Something story points and velocity will never include. And instead of going down the "we should just be better at estimating" road, I've taken an alternative road where cycle time and througput help us ask the right questions sooner.