During a Professional Agile Leadership training session, one of the participants asked me:
“Is there a relationship between the metrics used by an agile leader and the maturity level of that leader?”
This is an interesting question, because the topic of maturity is something I often associate with a leader’s behavior — how they lead their team or department.
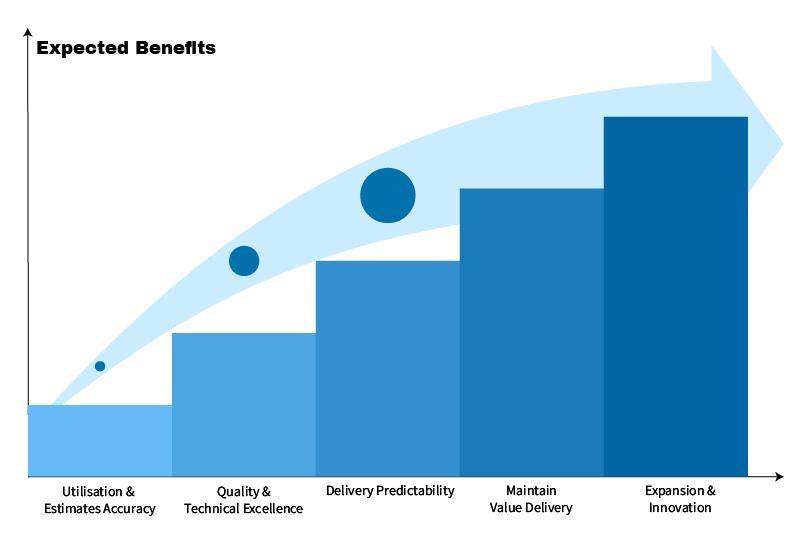
In connection with an article I wrote earlier about the maturity model for agile leaders, this time I will explain, based on my observations working with several companies, how the maturity level of an agile leader can be reflected in the metrics they emphasize.
This model can also be used to assess the maturity of a Product Owner or Scrum Master in your organization, since they are also leaders.
To understand the metrics used by leaders at higher levels, you can read my article on Evidence-Based Management (EBM) and the EBM Guide.

Level 1 – Utilization and Estimation Accuracy
In many organizations that claim to be agile, leaders (including Product Owners) still use metrics that emphasize team member utilization. This means every member’s time must be fully utilized up to 100%. No one should ever be idle; if they are, they are immediately assigned extra work, new projects, or asked to help other teams.
In such organizations, teams are usually not yet self-managing and are still directly managed by project managers or other leaders. This mindset is driven by traditional project management thinking, where success is measured by being on time, on scope, and on budget. Estimation accuracy and the number of completed items per Sprint (output) are still considered important, and the total scope is often allocated per Sprint during project planning.
Teams are viewed as feature factories, like in manufacturing, a productive team member is one who completes as many features as possible, regardless of the business value delivered.
Common metrics leaders at this level use include:
Team Capacity vs Actual Utilization
Sprint Plan vs Actual Delivery
Project Timeliness
Number of Hours Worked per Team Member
Number of Features Completed per Sprint
Estimate Accuracy
Velocity per Team Member
Many leaders still use these metrics because they are easy to measure and track. However, ease of measurement doesn’t mean the metric is meaningful. I often refer to such metrics as vanity metrics.
Teams in these environments often wonder whether their company is truly agile or simply running a short, iterative version of waterfall. Quality is frequently sacrificed to meet pre-set plans, and the Definition of Done often has a very low quality standard.
Leaders at this level typically don’t care much about the Definition of Done.
These leaders still have a limited understanding of agile and DevOps practices. They view Agile as “waterfall done faster and iteratively.” However, some are open-minded enough to realize that something about this approach doesn’t feel quite right.
Level 2 – Quality and Technical Excellence
Leaders who begin to open their minds realize that without technical excellence (such as DevOps practices), teams cannot remain sustainably agile. They’ve seen the negative impact of lowering the Definition of Done standards just to meet feature quotas or to maximize utilization.
These leaders start shifting gradually from a project mindset to a product mindset, enforcing higher quality and stricter Definition of Done standards, even if that means fewer Product Backlog Items are completed per Sprint.
They embrace one of the Agile Manifesto principles:
“Continuous attention to technical excellence and good design enhances agility.”
Such leaders encourage their teams to raise the Definition of Done standard at every Sprint Retrospective. They understand that Agile is a long-term investment, customer trust and product quality are more valuable than mere schedule adherence.
They’ve seen companies whose brand reputations suffered because teams compromised quality.
These leaders are willing to stand firm on quality principles even when challenged by senior management or other stakeholders.
They know that without strong quality, the company’s brand will be hurt in the long run.
Instead of forcing full utilization, they start measuring wasted time from context switching, when team members are moved between multiple projects or products.
Metrics leaders emphasized at this level include:
Defect Trends
Production Incidents per Sprint
Technical Debt Index
Mean Time to Repair
Mean Time to Restore Service
Mean Time to Remove Impediment
Mean Time Spent on Context Switching
Time Spent Merging Code Between Branches
Release Stabilization Period
Number of Improvements per Sprint
Frequency of Production-Ready Increment Delivered
Test Code Coverage
Number of Manual Tasks Automated
When teams notice that their leaders focus on quality and technical excellence, they begin to feel genuine goodwill. They take more ownership of product quality and review the Definition of Done seriously. They are becoming more professional by not downgrading the Definition of Done. As leaders see the real results of these improvements, they are motivated to keep learning and developing their capabilities as agile leaders.
Level 3 – Delivery Predictability
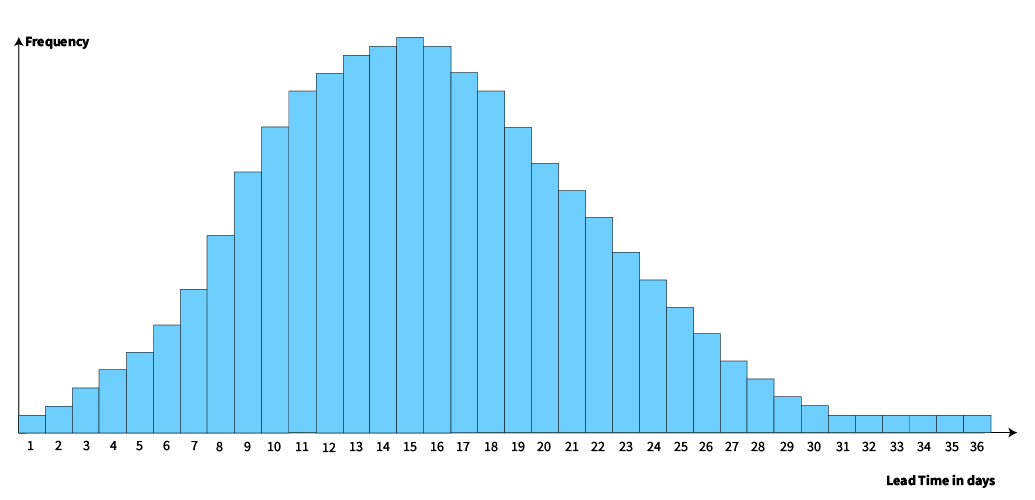
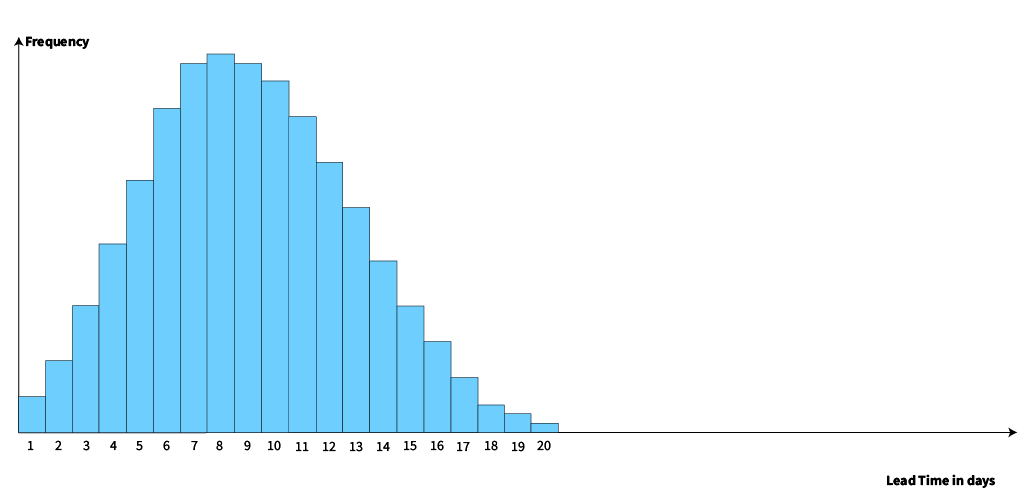
When teams can consistently deliver production-ready increments every Sprint, leaders begin to expect predictability in delivery. Predictability doesn’t mean perfect estimation accuracy, it means stability in lead time and cycle time, ideally visualized through a bell curve.


A team with a lead time range of 1–36 days is far less predictable than one with a 1–20 day range, as the first has a wider spread and a longer tail in its curve.
Metrics at this level include flow metrics, such as:
Customer Cycle Time
Lead Time
Lead Time for Changes
Time to Pivot
At this point, estimation accuracy becomes irrelevant. Leaders at this level use Monte Carlo statistical models combined with flow metrics to forecast completion or delivery dates.
To deepen understanding of predictability and flow metrics, one can attend the Professional Scrum with Kanban course.
In addition to flow metrics, Level 3 leaders emphasize DevOps metrics such as:
Build and Integration Frequency
Release Frequency
On-Product Index
Change Failure Percentage
Failed Deployment Recovery Time
Achieving a consistently predictable delivery team is not easy. Leaders at this level act as facilitators, enabling their teams to reach predictable delivery. They persist even when the journey is tough. To deepen understanding of facilitation, one can attend the Professional Scrum Facilitation Skills course.
Leaders at this level embrace another Agile Manifesto principle:
“Agile processes promote sustainable development. The sponsors, developers, and users should be able to maintain a constant pace indefinitely.”
Continuous Delivery is not an unattainable dream but a visible reality for these teams. As leaders see their teams becoming predictable in delivery, they continue learning alongside their teams, growing together as agile leaders. Their teams, in turn, become increasingly self-managing and professional as they witness their leader’s transformation.
Level 4 – Maintain Value Delivery
When teams are predictably delivering high-quality products, long-term value delivery becomes easier for senior management and stakeholders to forecast. At this stage, leaders transform into advisors. Their focus shifts from tactical and technical aspects to strategic thinking, how to ensure value delivery remains sustainable.
They develop a deeper product mindset, not just aiming for quality products (as in Level 2) but valuable products. They embrace another Agile Manifesto principle:
“Our highest priority is to satisfy the customer through early and continuous delivery of valuable software.”
They also begin educating senior management and stakeholders to forecast value delivery over multiple quarters while granting more autonomy to teams for self-management. At this level, trust between teams, leaders, senior management, and stakeholders grows stronger.
Metrics leaders emphasized include:
Revenue per Employee
Number of Transactions per Day
Average Amount per Transaction
Product Cost Ratio
Customer Usage Index
Active Customers
Customer Satisfaction
Customer Retention
Customer Referral
When teams see their leaders focusing on such value-oriented metrics, they become more self-managing. They start believing that agility in their company is not just a buzzword but a real commitment from leadership. Companies that consistently operate at this level naturally move to the next level.
Level 5 – Expansion and Innovation
Mature leaders understand that what is valuable today may not remain relevant tomorrow. Their focus shifts from maintaining value delivery to expanding and innovating.
Together with Product Owners, senior management, and stakeholders, they begin allocating at least x% of investment toward innovation and exploration, or unrealized value. Teams are encouraged to experiment continuously.
At this level, leaders believe experimentation is not optional, it’s essential for survival. Without experimentation, the company will lose competitiveness and relevance in the market. Level 5 leaders understand that agility is not about speed, it’s about long-term sustainability. Sustainability comes from continuously innovating to avoid stagnation and irrelevance.
Metrics used at this level include:
Number of Experiments per Sprint
Number of Failed Experiments
Potential Market Share
Stock Market Index
Return on Investment
Customer/User Satisfaction Gap
Desired Customer Experience
Top-of-Mind Index
Mean Time-to-Learn
Employee Satisfaction
Teams led by leaders at this level experience true agility. They feel psychological safety, as failure is not used to assign blame but to fuel innovation and sustainability. They feel more challenged, motivated, and engaged in their work.
From my personal experience, working in such a company is deeply inspiring.
Closing Thoughts
This, then, is the evolution and maturity model for Agile Leaders, viewed through the lens of the metrics they emphasize.
I hope this model helps leaders in agile organizations continue to evolve and grow sustainably over time. So, as a leader, which level do you think you’re at? And if you’re part of a team, what kinds of metrics does your leader still focus on?
The first step to learning how to become an agile leader is by joining the PAL-E (Professional Agile Leadership Essentials) training we facilitate.
Have questions? Feel free to reach out directly via that number or fill out the contact form provided.
